Crucial Comix logo on a green background
$10.00 1

Cart

Published July 10, 2025
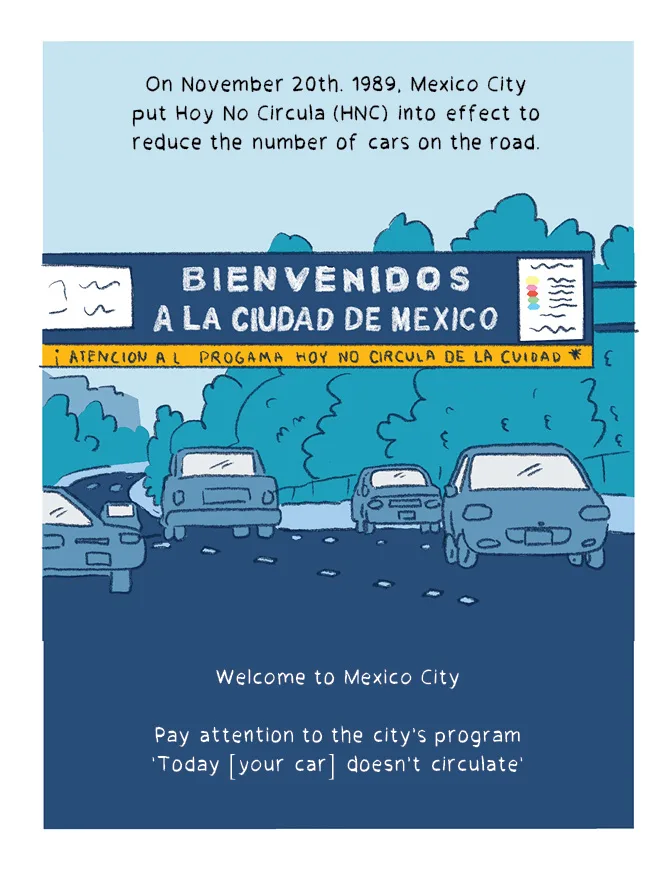
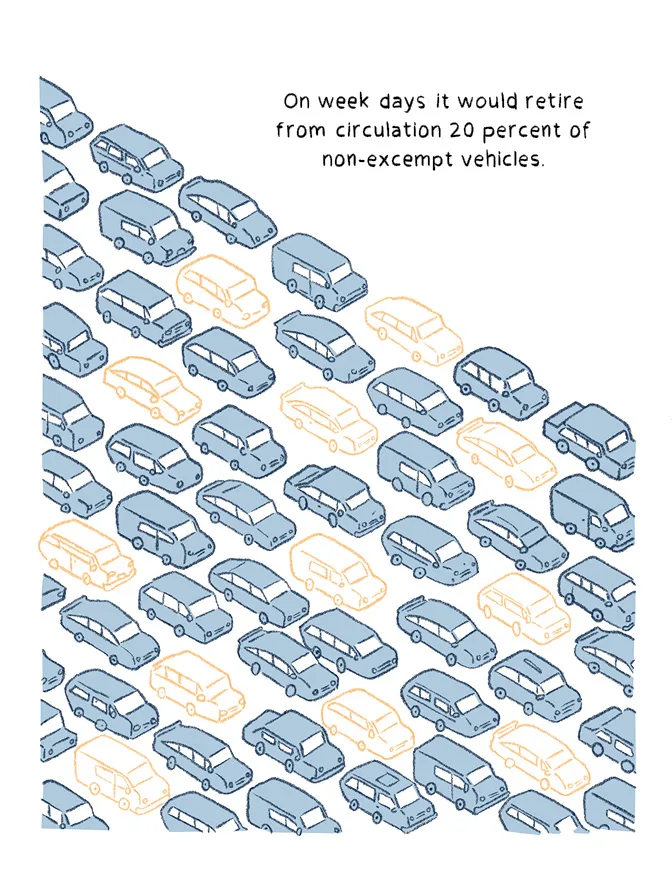
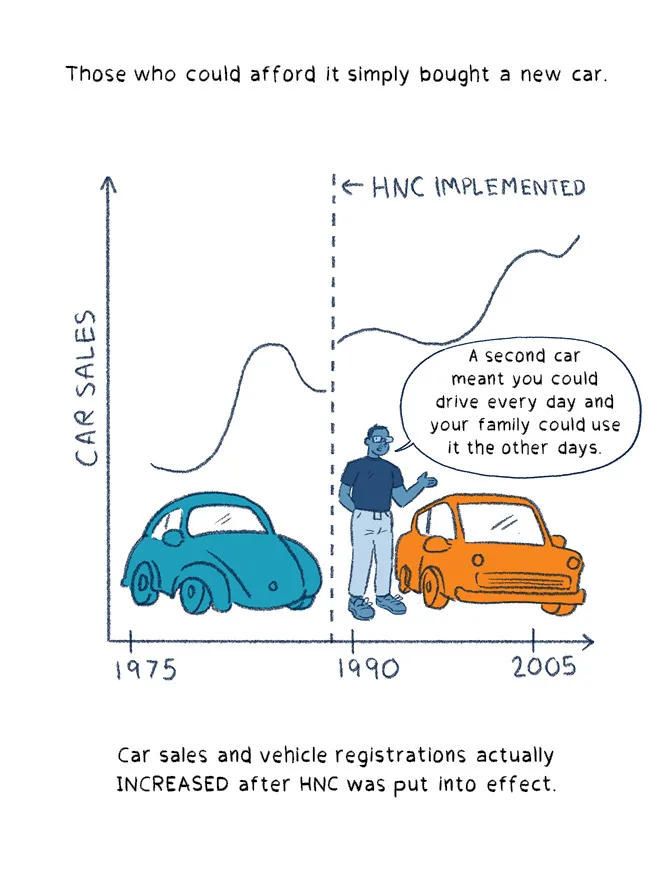
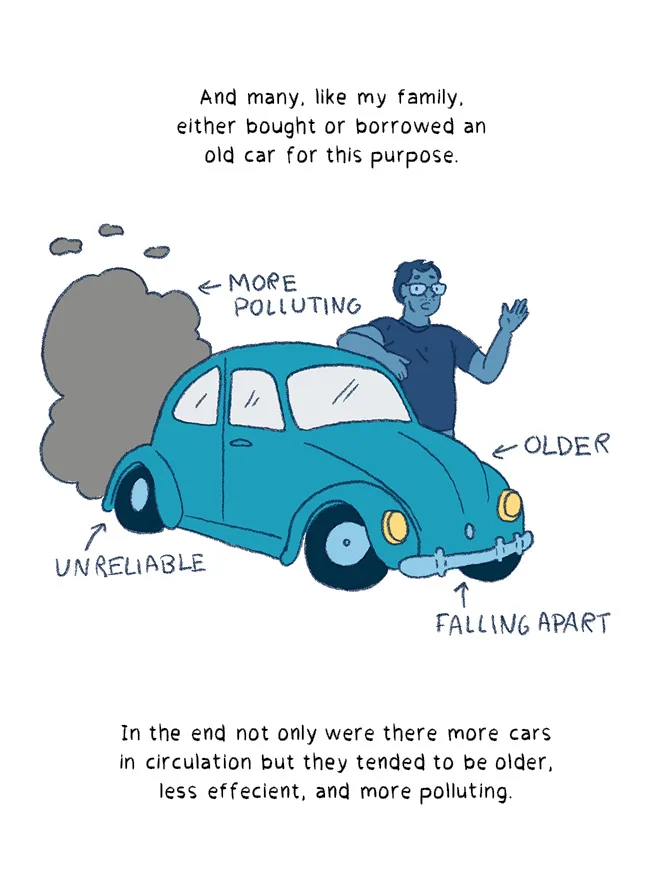
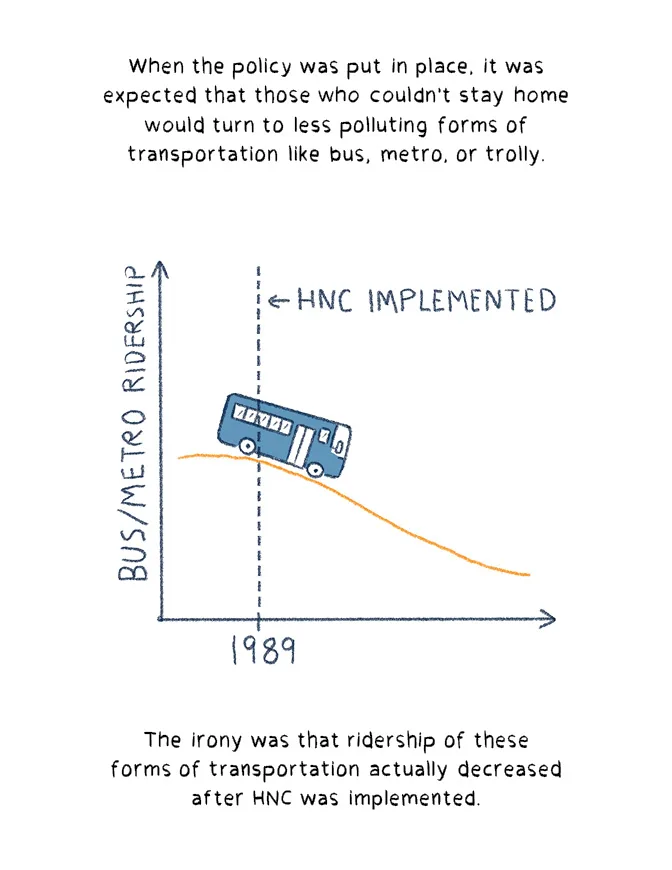
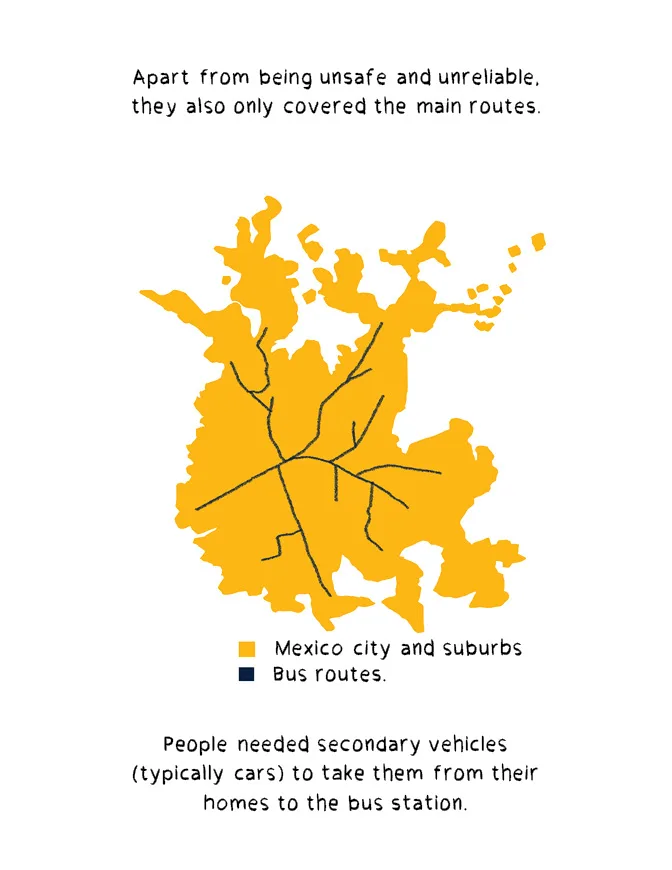
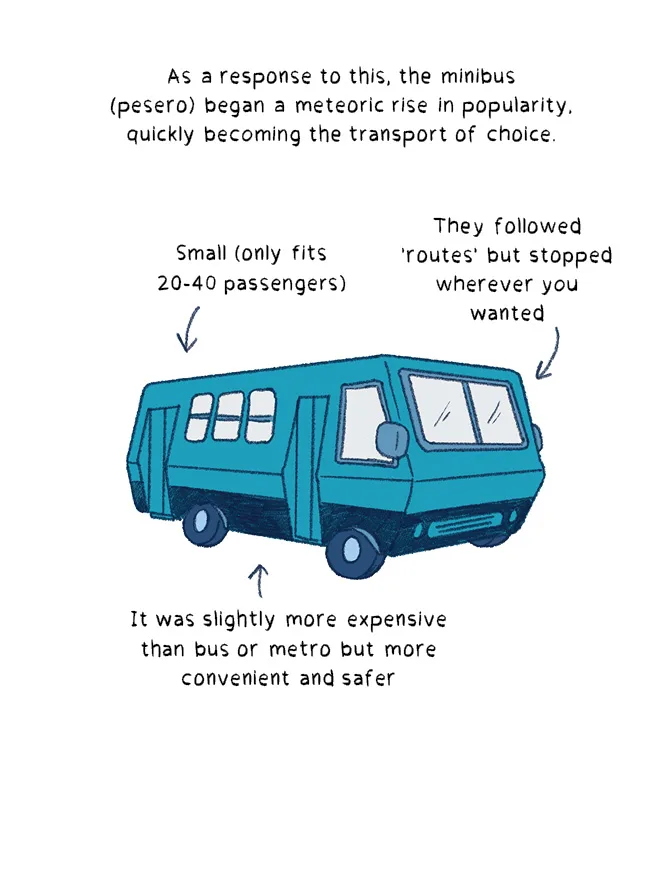
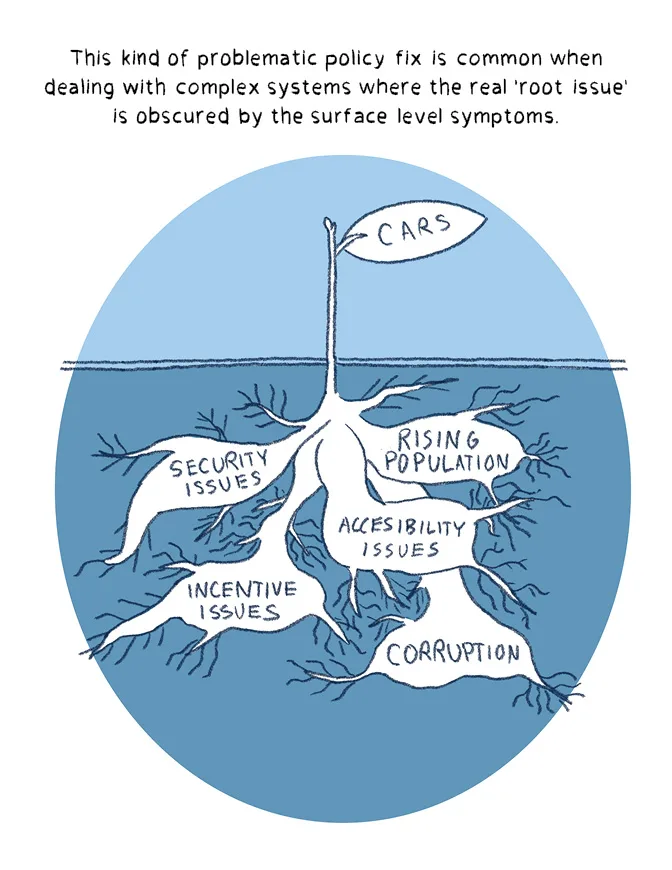
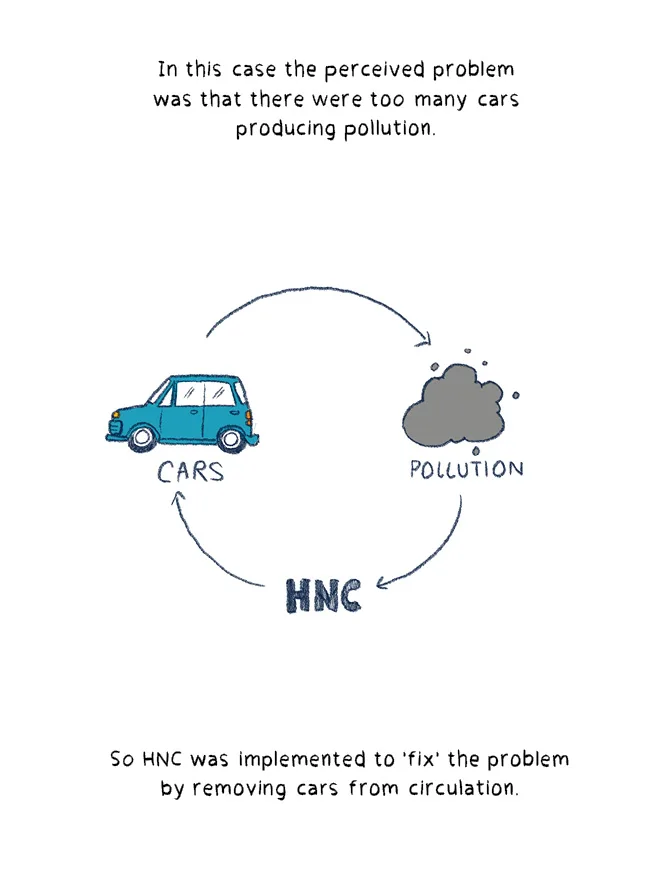
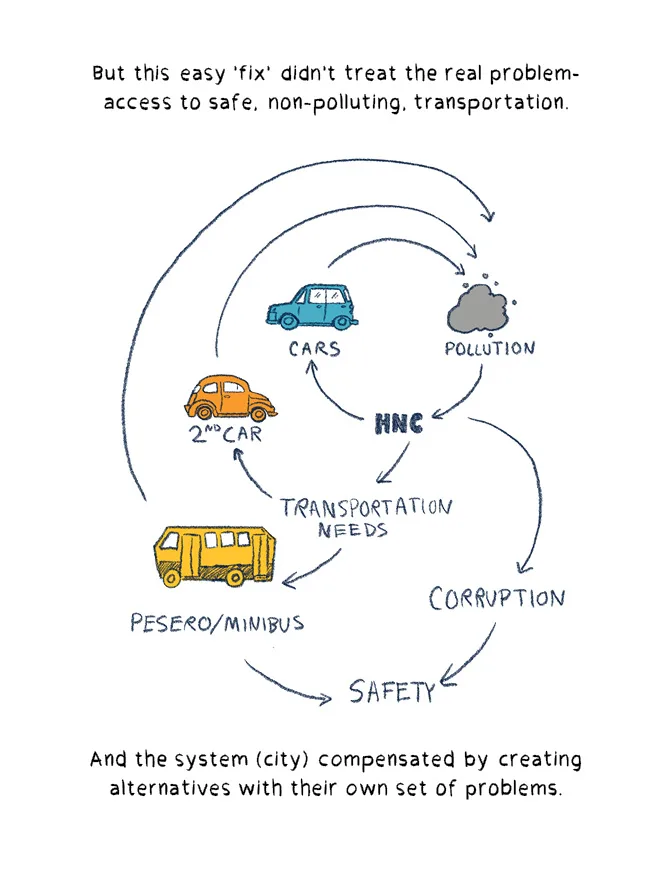
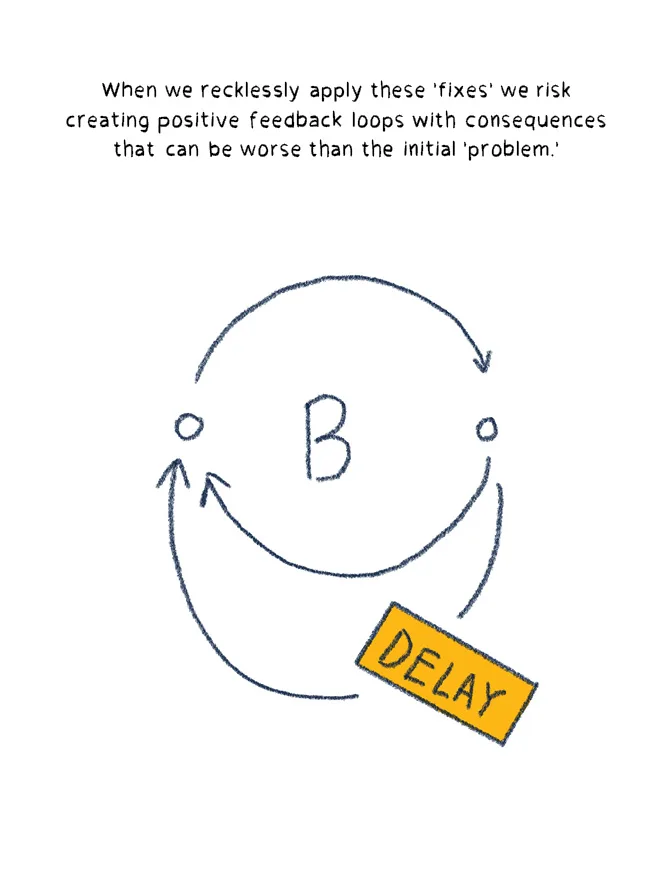
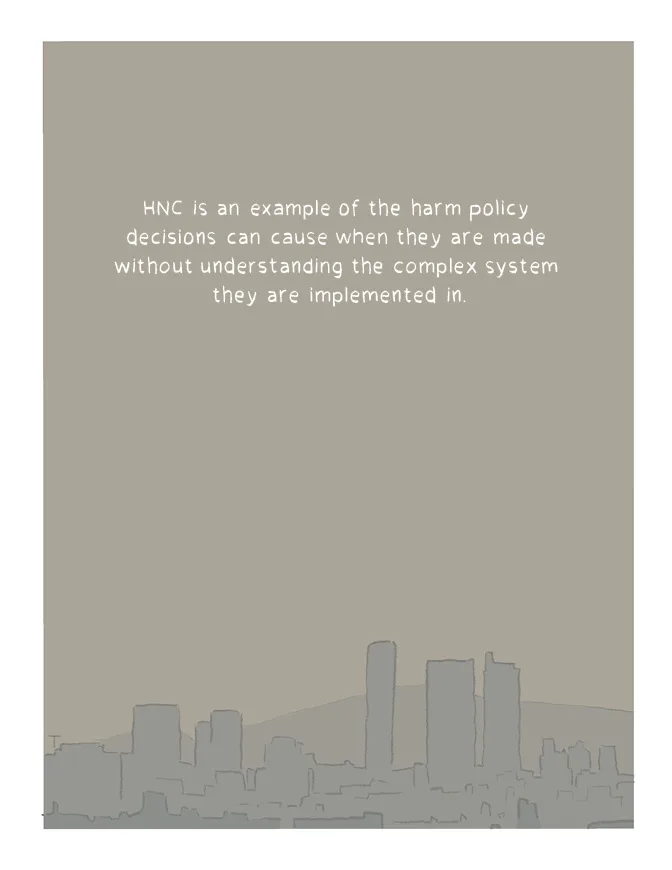
Hoy No Circula

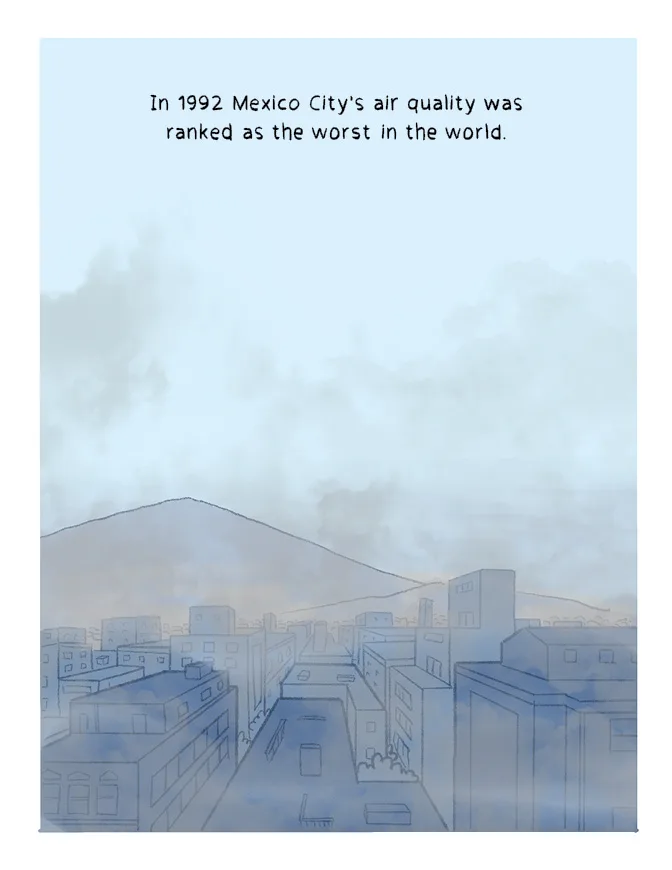
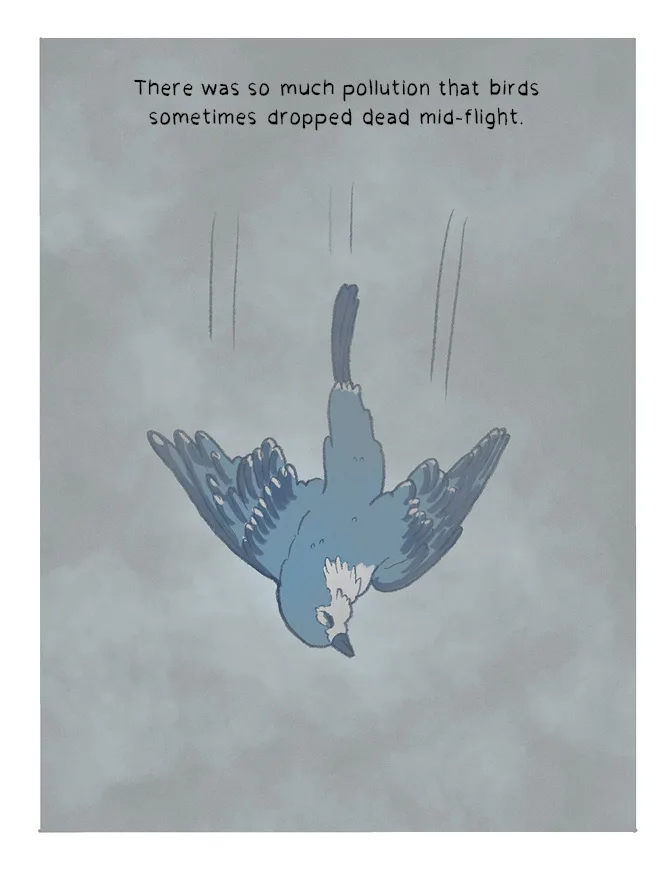
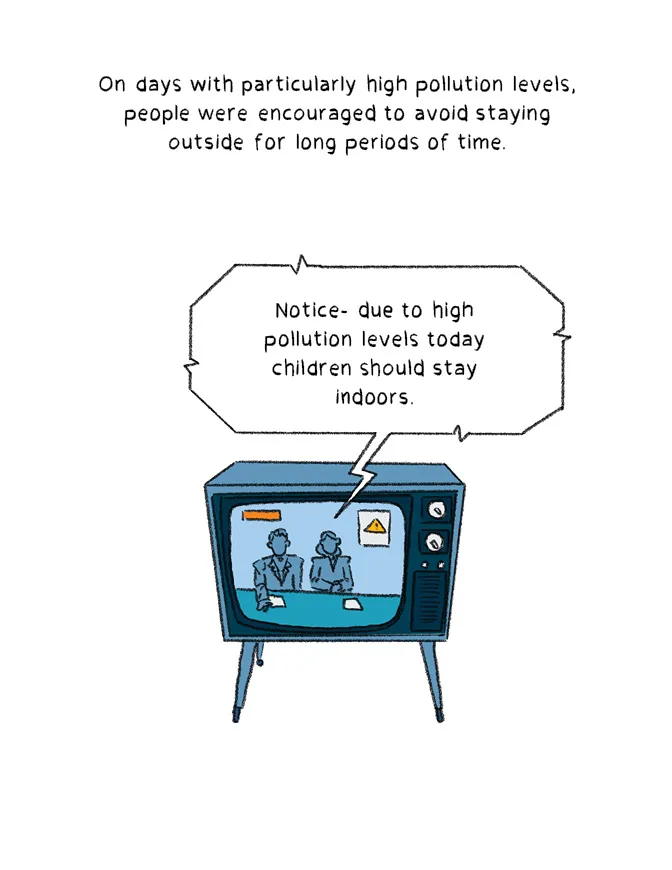
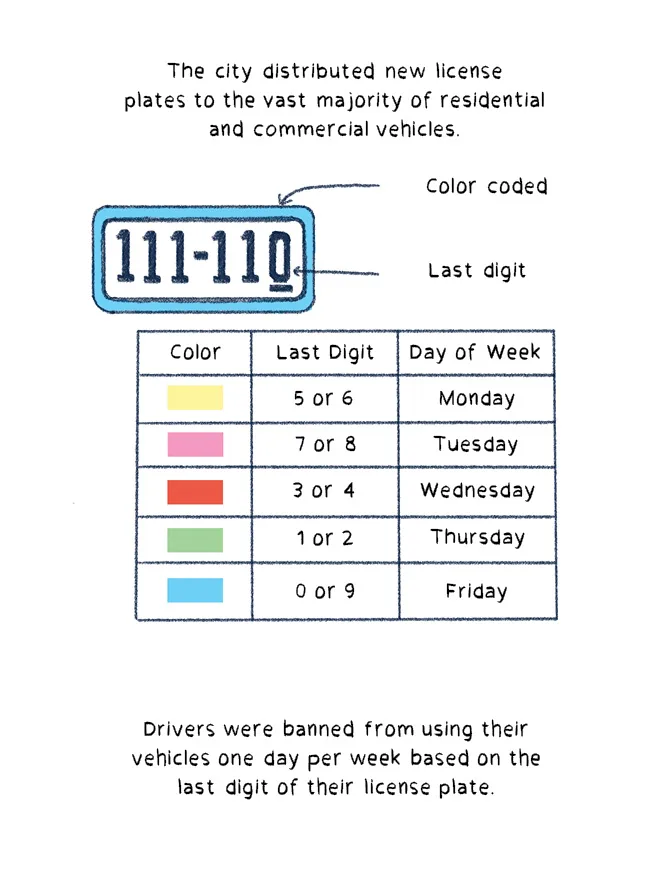
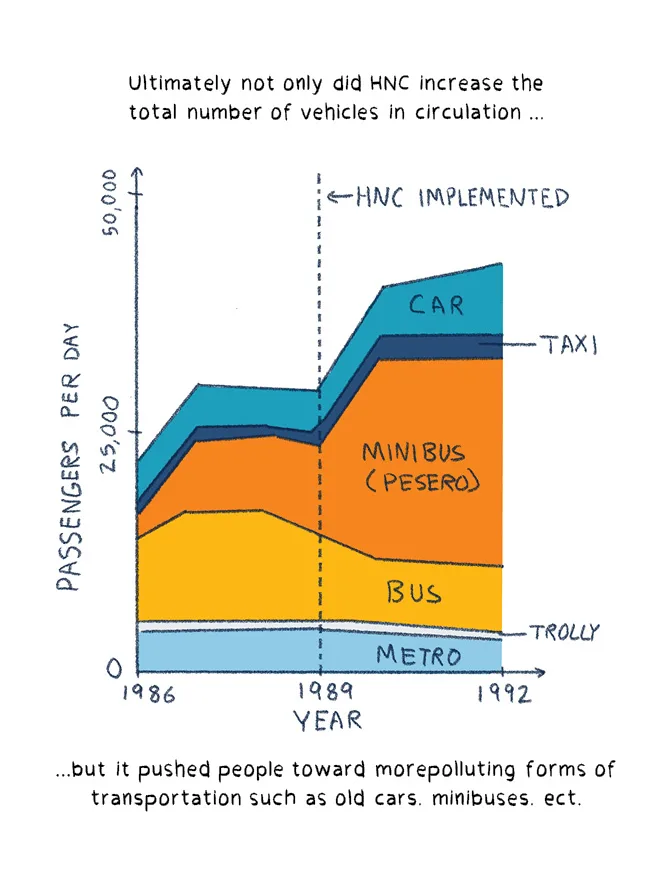
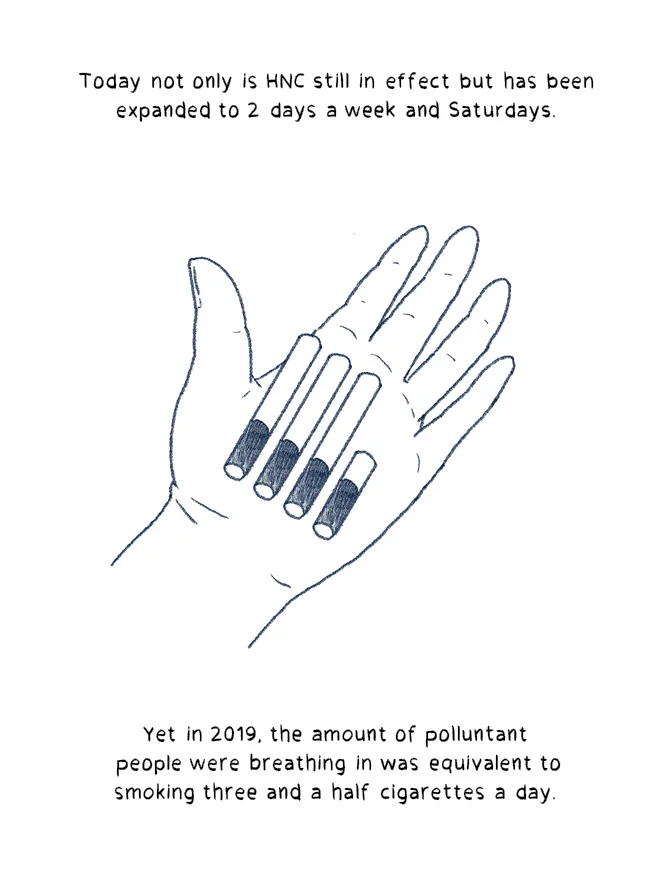
To fight pollution, in 1989 Mexico City passed a law to limit the number of cars on the road. How did that turn out?
A cityscape in hues of blue with a mountain range in the distance is covered with a hazy grey smog. Text at the top of the page in the sky reads “In 1992 Mexico City’s air quality was ranked as the worst in the world.”A busy city street is filled with traffic, hundreds of cars releasing pollutants that fill the street and make it hazy. In the distance through the haze the Mexico City landmark ‘Angel of Independence’ can be seen through the smog. Text at the top of the image reads “Toward the end of the 80s the population of Mexico City was reaching 15 million. 15 million people moving around— going to work, school, grocery shopping and polluting.”An aerial view of Mexico City, a large metropolis expanding between two mountain ranges. Smog gathers above the city, clouding the view. Text at the top of the image reads “Mexico City is nestled between two mountain ranges that trap pollution and slow how quickly pollutants clear the city.”An aerial view of a city block seen through gaps in a thick smog–the streets are jam-packed with cars and the buildings and cars are in hues of blue with yellow windows. Text at the top of the image reads “Mexico City was facing record levels of ozone and other airborne pollutants.”A bird free falling through hazy smog. Text at the top of the image reads “There was so much pollution that birds sometimes dropped dead mid-flight.”An older TV showing a news broadcast with a pair of anchors in blues and a yellow caution sign in the corner of the TV. Text at the top of the image reads “On days with particularly high pollution levels, people were encouraged to avoid staying outside for long periods of time.” A word bubble coming from one of the anchors reads “Notice- due to high pollution levels today children should stay indoors.”An image of a highway with cars heading into Mexico City passing underneath a highway sign in Spanish. Text at the top of the image reads “On November 20th 1989, Mexico City put Hoy no Circula (HNC) into effect to reduce the number of cars on the road. At the bottom of the image the highway sign is translated into English reading “Welcome to Mexico City. Pay attention to the city’s program ‘Today your car doesn’t circulate.”At the top of the page the text reads “The city distributed new license plates to the vast majority of residential and commercial vehicles.” Below an image of a license plate with a band of blue around the edge of it and six numbers with the last one underlined. An arrow points from the words “color coded” to the band of blue and a second arrow points from the words “Last digit” to the underlined number. Underneath that is a table with three columns and 5 rows. The first column is titled “Color”, second column is titled “Last digit”, and the third column is titled “Day of the Week". The first row reads “Yellow, 5 or 6, and Monday.” The second row reads “Pink, 7 or 8, and Tuesday.” The third row reads “Red, 3 or 4, and Wednesday.” The fourth row reads “Green, 1 or 2, and Thursday.” The last row reads “Blue, 0 or 9, and Friday.”An aerial view of lots of cars in lanes all facing the same direction- towards the bottom right of the image. The majority of the cars are drawn in a dark blue line and colored light blue. About 20% of the cars are drawn in a yellow line and have no color. At the top of the page the text reads “On weekdays it would retire from circulation 20 percent of non-exempt vehicles.”At the top of the page the text reads “The new plates were cheap to produce and distribute and it would be easy to enforce since vehicles not in compliance were easily spotted.” Below a front view of a car with a policeman at the driver’s window. A word bubble shows the police saying “The fine is 200 dollars and 48 hours impounded. Or you can just give me 100 right now” to the driver. At the bottom of the page the text reads “And it was… enthusiastically enforced by police.”Text at the top of the page reads “At first glance it was the perfect solution- simple, easy to implement, and effective.” A man with glasses and a skeptical expression addresses the reader directly- a word bubble reads “But what did they expect people to do? Just stop going to school, work, living life that day?” The text at the bottom of the page reads “My father Enrique, who was a student living in Mexico City at the time.”Text at the top of the page reads “HNC’s calculation that it would reduce emissions by 12% implies that the 20 percent of people who were banned from driving would just stay home.” The image is of Enrique addressing the reader with a concerned expression. A word bubble that reads “It was as absurd as being told not to breathe one day a week. People just found ways around it.”At the top of the page the text reads “Those who could afford it simply bought a new car.” The image is a graph- the y-axis is labeled car sales and the x-axis is labeled by three years- 1975, 1990, and 2005. The line of the graph is trending upwards with a big jump right before 1990 marked by a dotted line which is labeled “HNC implemented.” On the x-axis of the graph stands Enrique besides two cars addressing the reader with a word bubble that reads “A second car meant you could drive every day and your family could use it the other days.” Text at the bottom of the page reads “Car sales and vehicle registrations actually INCREASED after HNC was put into effect.”The text at the top of the page reads “And many, like my family, either bought or borrowed an old car for this purpose.” The image is of Enrique standing next to an old car that is releasing a lot of emissions. Four labels point to different parts of the car with arrows that read “More polluting,” “older,” “unreliable” and “falling apart.” Text at the bottom of the page reads “In the end not only were there more cars in circulation but they tended to be older, less efficient, and more polluting.”The text at the top of the page reads “When the policy was put in place, it was expected that those who couldn’t stay home would turn to less polluting forms of transportation like bus, metro, or trolly.” The image is a graph. The y-axis is labeled “Bus/Metro Ridership” and the x-axis is time in years. A yellow line shows the Bus/Metro ridership number decreasing over time with a little bus ‘riding’ the line downwards. A dotted line with the label “HNC Implemented” marks 1989 and the yellow line starts to decrease after that year. Text at the bottom of the page reads “The irony was that ridership of these forms of transportation actually decreased after HNC was implemented.”Text at the top of the page reads “Apart from being unsafe and unreliable, they also only covered the main routes.” The image is a map showing the Mexico city and Suburbs in solid yellow and the available bus routes in blue line, which clearly do not reach the outer areas and leave big gaps within the city as well. Text at the bottom of the page reads “People needed secondary vehicles (typically cars) to take them from their homes to the bus station.”The text at the top of the page reads “As a response to this, the minibus (pesero) began a meteoric rise in popularity, quickly becoming the transport of choice.” The image is of a minibus. Three labels with arrows pointing to the arrow bus read “Small (only fits 20-40 passengers)”, “They followed ‘routes’ but stopped wherever you wanted”, and “It was slightly more expensive than bus or metro but more convenient and safer.”The text at the top of the page reads “The minibus could not only drop you off at your house but also extend to more remote areas.” The image is the same map of Mexico City and Suburbs with dark blue bus routes but now also includes a light blue line labeled “Minibus routes.” The minibus routes cover far more of the map than the bus routes, extending further and filling in the gaps.The image is of Enrique standing in a road surrounded by minibuses and “Beep” sound effects. He addresses the reader directly with a word balloon “The minibuses were everywhere! Blocking traffic, fighting for routes and passengers- like gangs.” Text at the bottom of the page reads “And, unfortunately, they were a high-emission form of transportation– unable to carry many passengers compared to metro or bus.”Text at the top of the page reads “Ultimately not only did HNC increase the total number of vehicles in circulation…” The image is a stacked area chart. The x-axis is labeled year with three points labeled 1986 (pre-HNC), 1989 (when HNC was implemented), and 1992 (post HNC). The y-axis is labeled “Passengers per day” and starts at 0 and goes up to 50,00 The graph has six kinds of transportation stacked on top of each other- car, taxi, minibus, bus, trolley, and metro. The graph shows a general total passenger increase- a little under 25,000 in 1986, to around 40,000. Taxi, metro, and trolley ridership generally decreased- staying roughly the same number of passengers despite a general total passenger increase. Bus ridership decreased– in 1986 it made up roughly 30% of ridership, 25% in 1989, and a little less than 20% in 1992. Car ridership lessened only slightly- starting in 1986 it makes up about 25% of ridership, 20% in 1989, and 22% in 1992. Minibuses have an explosive growth- making up less than 16% of ridership in 1986, 25% in 1989, and reaching about 50% in 1992. The text at the bottom of the panel reads “...but it pushed people toward more polluting forms of transportation such as old cars. minibuses. Ect.”The image is of a small plant with a single leaf labeled ‘cars’ and beneath the surface in the soil it has many large roots labeled ‘security issues, rising population, accessibility issues, incentive issues, and corruption. The text at the top of the page reads “This kind of problematic policy fix is common when dealing with complex systems where the real ‘root issue’ is obscured by the surface level symptoms.”Text at the top of the page reads “In this case the perceived problem was that there were too many cars producing pollution.” The image is of a simple loop diagram. ‘Cars’ lead to more ‘Pollution’, ‘HNC’ decreases ‘Cars’, so decreases ‘Pollution’ in a loop. Text at the bottom of the page reads “So HNC was implemented to ‘fix’ the problem by removing cars from circulation.”Text at the top of the page reads “But this easy ‘fix’ didn’t treat the real problem– access to safe, non-polluting, transportation.” The image is of a more complex loop diagram. At the center of the diagram is the same loop as before– ‘Cars’ lead to more ‘Pollution’, ‘HNC’ decreases ‘Cars’, so decreases ‘Pollution’. But from ‘HNC’ two new arrows lead to ‘Transportation Needs’ and ‘Corruption’. The ‘Transportation Needs’ Feeds into both ‘2nd Car’ and ‘Pesero/Minibus’ which in turn feed back into ‘Pollution.’ Then ‘Corruption’ and ‘Pesero/Minibus’ both feed into ‘Safety.’The text at the top of the page reads “When we recklessly apply these ‘fixes’ we risk creating positive feedback loops with consequences that can be worse than the initial ‘problem.’’ The image is of a generic loop diagram labeled ‘B’ that shows a simple loop- one point feeds into a second point which then feeds back into the first point. A second arrow from the second point, labeled ‘Delay’, also feeds back into the first point.Text at the top of the page reads ‘Today not only is HNC still in effect but has been expanded to 2 days a week and Saturdays.’ The image is of a hand holding three and a half cigarettes. Text at the bottom of the page reads ‘Yet in 2019, the amount of pollutants people were breathing in was equivalent to smoking three and a half cigarettes a day.”The image is of Mexico City’s skyline which can be seen through a thick and hazy smog. Text at the top of the page reads ‘HNC is an example of the harm policy decisions can cause when they are made without understanding the complex system they are implemented in.”The image is of a man with glasses, salt and pepper hair, and a light mustache with a label reading ‘My Dad, Enrique Campos Nanez.’ Text at the top of the page reads “This comic is an adaptation of a case study put together for a system dynamics class my father taught when he was a professor at George Washington University.” Text at the bottom of the page reads “System Dynamics is a computer-based mathematical modeling approach for strategy development and better decision making in complex systems. This approach uses computer-aided simulation methodology based on feedback systems theory which complements the other Systems Thinking approaches. Systems Thinking is a holistic approach to analysis that focuses on the way that a system’s constituent parts interrelate and how systems work over time and within the context of larger systems.”A list of sources “Riveros, Hector G., Cabrera, Enrique. “El ‘Hoy No circula’ y nosotros los mexicanos” Ciencias. 1998 Davis, Lucas W. “The Effect of Driving Restrictions on Air Quality in Mexico City” Journal of Political Economy. 2008 Riveros, Hector G. “Analysis del programa ‘Hoy no circula”’ Ciencia. 2009 Campos Nanez, Enrique ‘First order Linear Systems’ George Washington University Lecture 2013 Irelad, Corydon ‘Coming up for air’ The harvard gazette. October 28. 2014 Davison, Tamara ‘Mexico City’s air is bad for you’ Latin America Reports March 1. 2019

More Comics

© 2025 Crucial Comix